Plot LOD curves for a genome scan
Plot LOD curves for a genome scan
Usage
ggplot_scan1(
  object,
  map,
  lodcolumn = 1,
  chr = NULL,
  gap = 25,
  bgcolor = "gray90",
  altbgcolor = "gray85",
  ...
)

# S3 method for class 'scan1'
autoplot(object, ...)

ggplot_scan1_internal(
  map,
  lod,
  gap = 25,
  col = NULL,
  shape = NULL,
  pattern = NULL,
  facet = NULL,
  patterns = c("none", "all", "hilit"),
  chrName = "Chr",
  ...
)
Arguments
- object
Output of
scan1.- map
Map of pseudomarker locations.
- lodcolumn
LOD score column to plot (a numeric index, or a character string for a column name). One or more value(s) allowed.
- chr
Selected chromosomes to plot; a vector of character strings.
- gap
Gap between chromosomes.
- bgcolor
Background color for the plot.
- altbgcolor
Background color for alternate chromosomes.
- ...
Additional graphics parameters.
- lod
Matrix of lod (or other) values.
- col
Colors for points or lines, with labels.
- shape
Shapes for points.
- pattern
Use to group values for plotting (default =
NULL); typically provided byplot_snpassointernal routine.- facet
Plot facets if multiple phenotypes and group provided (default =
NULL).- patterns
Connect SDP patterns: one of
c("none","all","hilit").- chrName
Add prefix chromosome name (default
"Chr").
Examples
# load qtl2 package for data and genoprob calculation
library(qtl2)
# read data
iron <- read_cross2(system.file("extdata", "iron.zip", package="qtl2"))
# insert pseudomarkers into map
map <- insert_pseudomarkers(iron$gmap, step=1)
# calculate genotype probabilities
probs <- calc_genoprob(iron, map, error_prob=0.002)
# grab phenotypes and covariates; ensure that covariates have names attribute
pheno <- iron$pheno
covar <- match(iron$covar$sex, c("f", "m")) # make numeric
names(covar) <- rownames(iron$covar)
Xcovar <- get_x_covar(iron)
# perform genome scan
out <- scan1(probs, pheno, addcovar=covar, Xcovar=Xcovar)
# plot the results for selected chromosomes
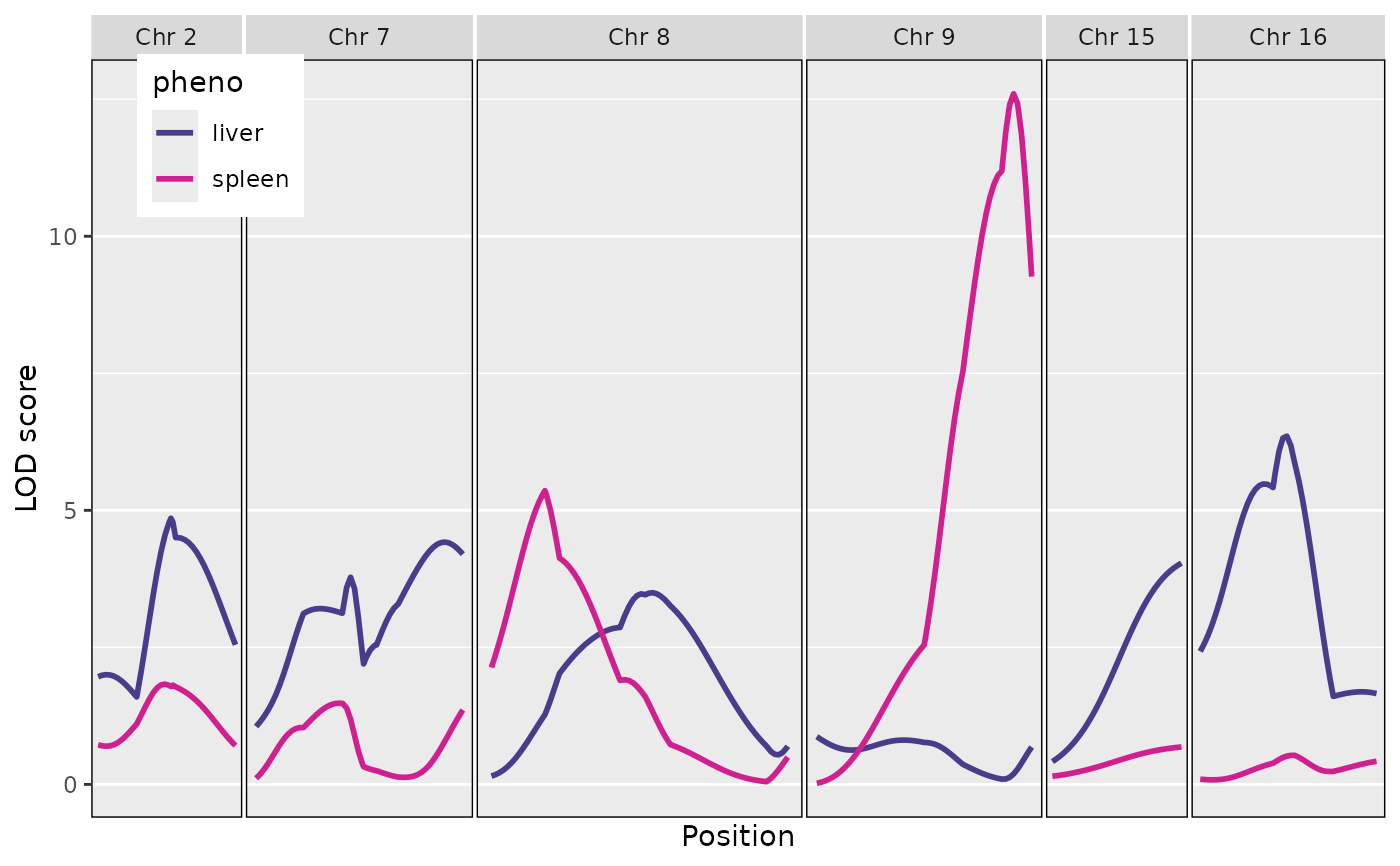
chr <- c(2,7,8,9,15,16)
ggplot_scan1(out, map, lodcolumn=1:2, chr=chr, col=c("darkslateblue","violetred"),
legend.position=c(0.1,0.9))
 # plot just one chromosome
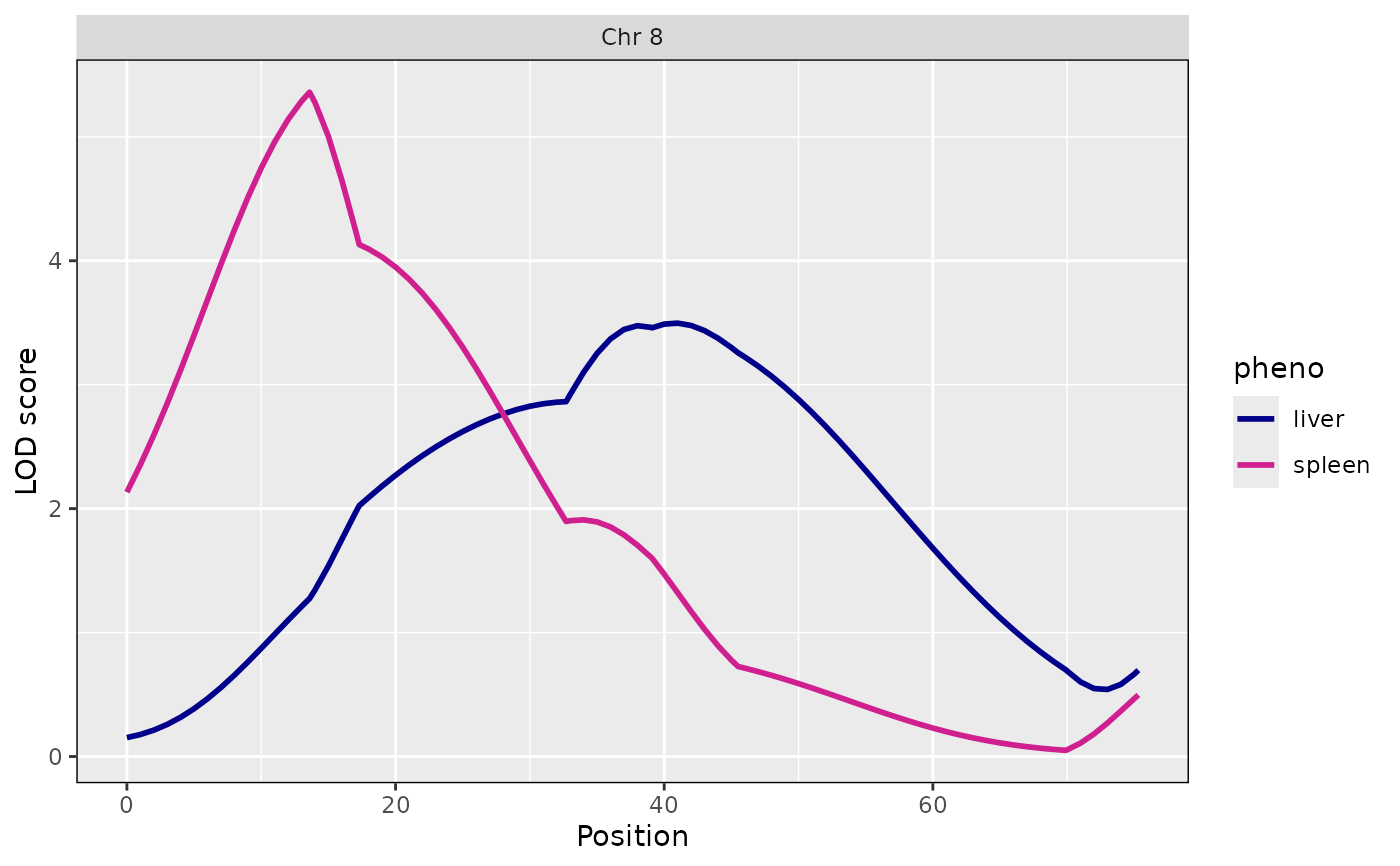
ggplot_scan1(out, map, chr=8, lodcolumn=1:2, col=c("darkblue","violetred"))
# plot just one chromosome
ggplot_scan1(out, map, chr=8, lodcolumn=1:2, col=c("darkblue","violetred"))
 # can also use autoplot from ggplot2
# lodcolumn can also be a column name
library(ggplot2)
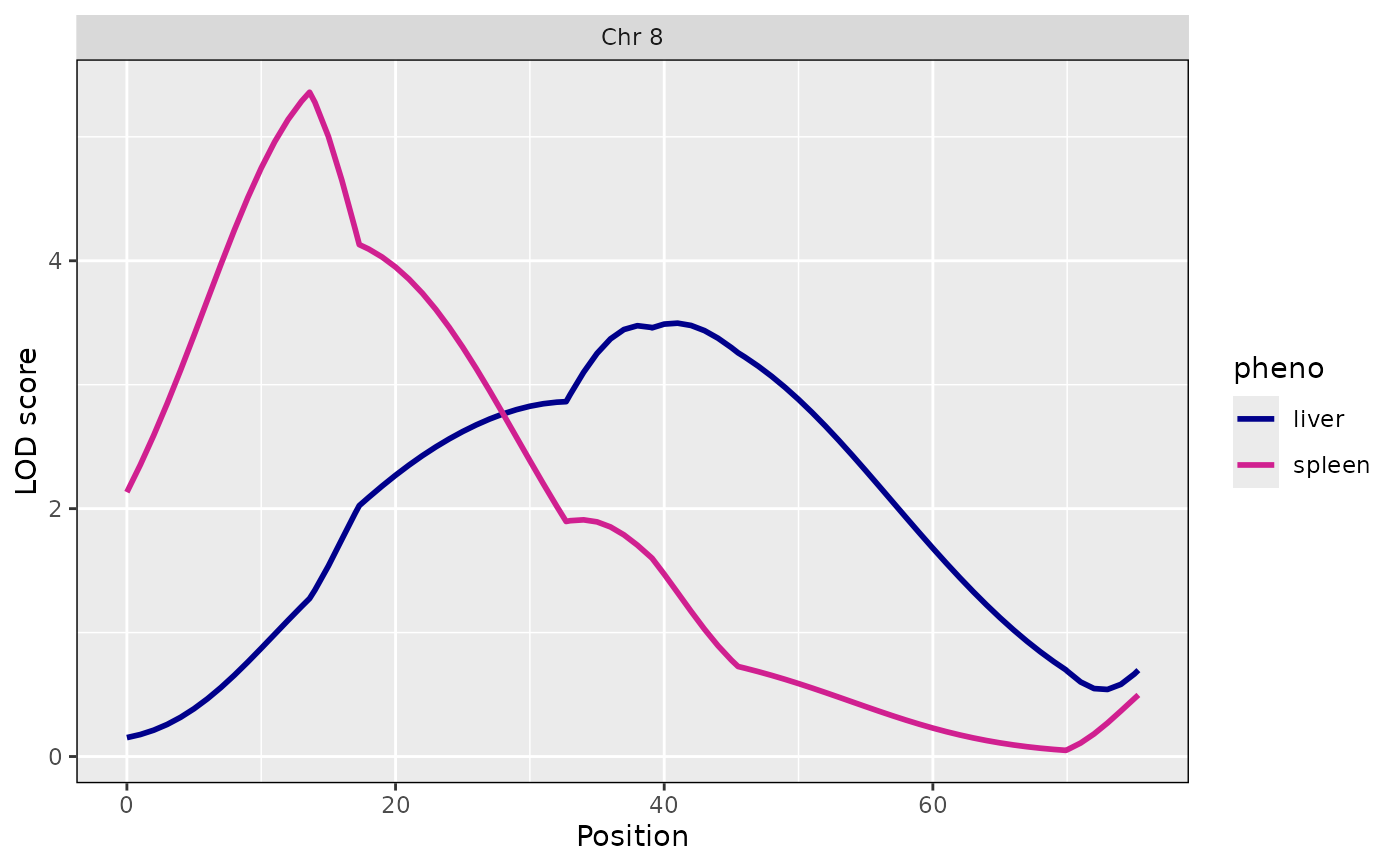
autoplot(out, map, chr=8, lodcolumn=c("liver","spleen"), col=c("darkblue","violetred"))
# can also use autoplot from ggplot2
# lodcolumn can also be a column name
library(ggplot2)
autoplot(out, map, chr=8, lodcolumn=c("liver","spleen"), col=c("darkblue","violetred"))