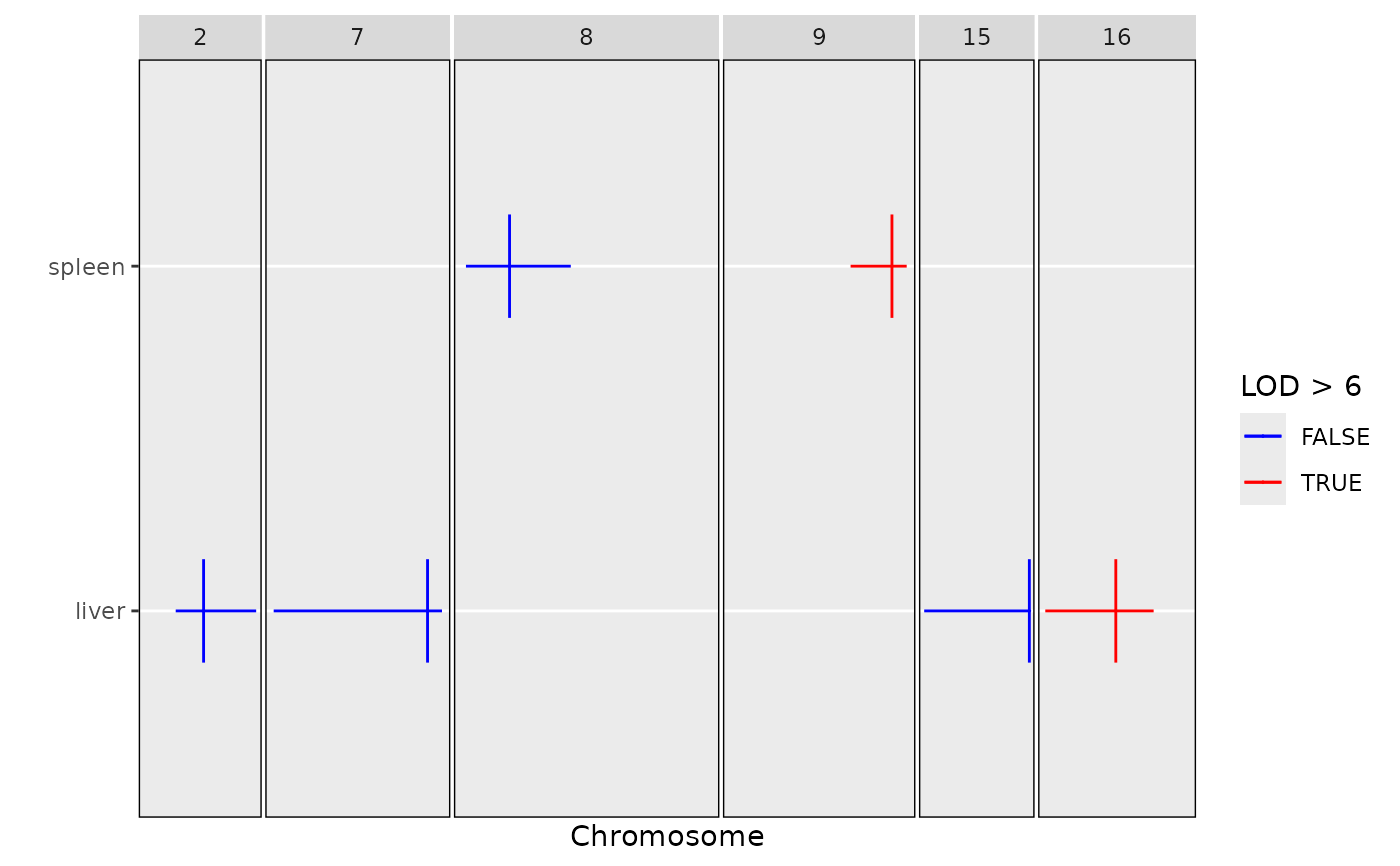
Plot QTL peak locations (possibly with intervals) for multiple traits.
Usage
ggplot_peaks(
  peaks,
  map,
  chr = NULL,
  tick_height = 0.3,
  gap = 25,
  bgcolor = "gray90",
  altbgcolor = "gray85",
  ...
)
Arguments
- peaks
Data frame such as that produced by
find_peaks) containing columnschr,pos,lodindex, andlodcolumn. May also contain columnsci_loandci_hi, in which case intervals will be plotted.- map
Marker map, used to get chromosome lengths (and start and end positions).
- chr
Selected chromosomes to plot; a vector of character strings.
- tick_height
Height of tick marks at the peaks (a number between 0 and 1).
- gap
Gap between chromosomes.
- bgcolor
Background color for the plot.
- altbgcolor
Background color for alternate chromosomes.
- ...
Additional graphics parameters
Examples
# load qtl2 package for data and genoprob calculation
library(qtl2)
# read data
iron <- read_cross2(system.file("extdata", "iron.zip", package="qtl2"))
# insert pseudomarkers into map
map <- insert_pseudomarkers(iron$gmap, step=1)
# calculate genotype probabilities
probs <- calc_genoprob(iron, map, error_prob=0.002)
# grab phenotypes and covariates; ensure that covariates have names attribute
pheno <- iron$pheno
covar <- match(iron$covar$sex, c("f", "m")) # make numeric
names(covar) <- rownames(iron$covar)
Xcovar <- get_x_covar(iron)
# perform genome scan
out <- scan1(probs, pheno, addcovar=covar, Xcovar=Xcovar)
# find peaks above lod=3.5 (and calculate 1.5-LOD support intervals)
peaks <- find_peaks(out, map, threshold=3.5, drop=1.5)
# color peaks above 6 red; only show chromosomes with peaks
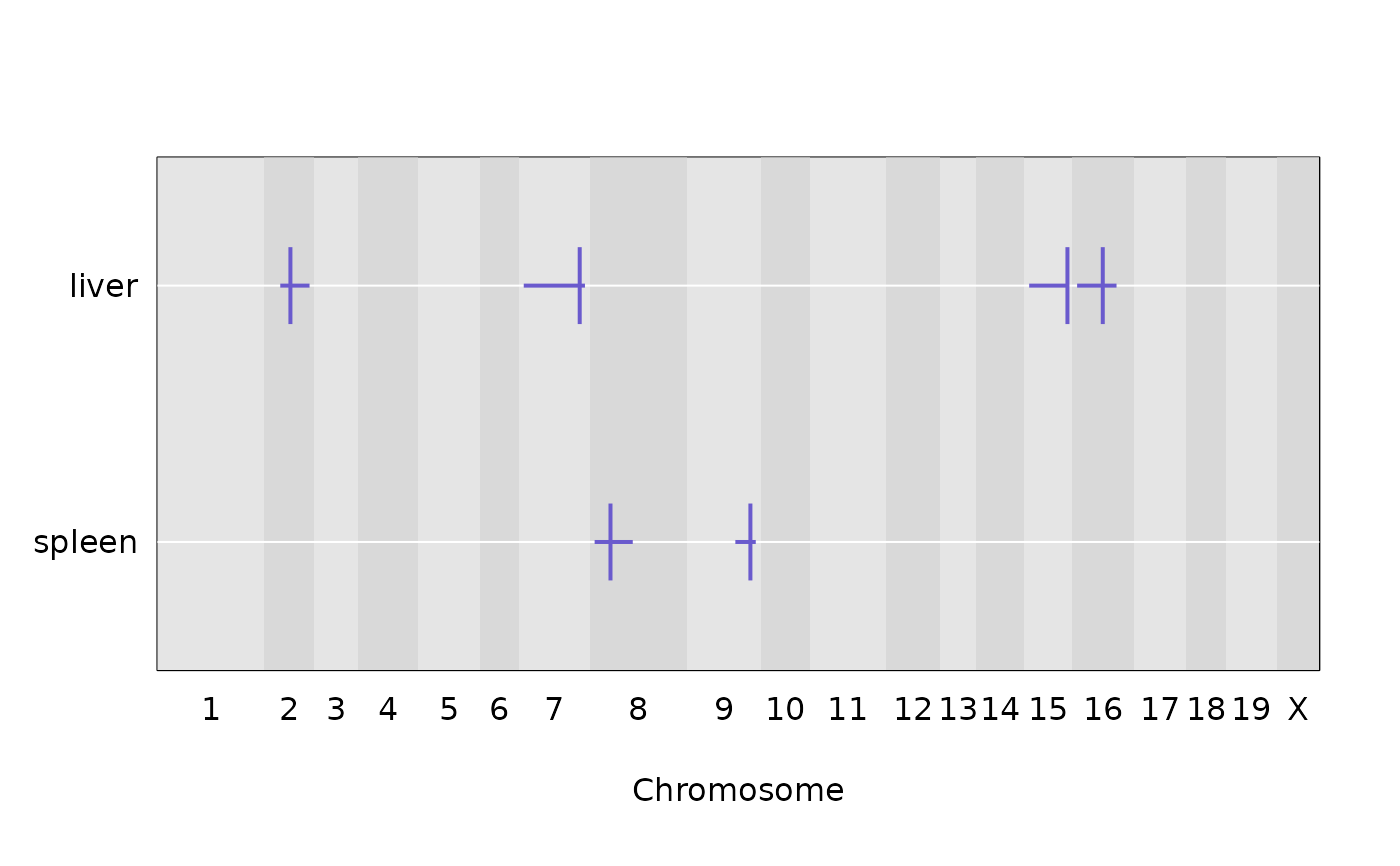
plot_peaks(peaks, map)
 peaks$col <- (peaks$lod > 6)
ggplot_peaks(peaks, map[names(map) %in% peaks$chr], col = c("blue","red"),
legend.title = "LOD > 6")
peaks$col <- (peaks$lod > 6)
ggplot_peaks(peaks, map[names(map) %in% peaks$chr], col = c("blue","red"),
legend.title = "LOD > 6")