Plot one individual's genome-wide genotypes
Usage
ggplot_onegeno(
  geno,
  map,
  ind = 1,
  chr = NULL,
  col = NULL,
  shift = FALSE,
  chrwidth = 0.5,
  ...
)
Arguments
- geno
Imputed phase-known genotypes, as a list of matrices (as produced by
maxmarg) or a list of three-dimensional arrays (as produced byguess_phase).- map
Marker map (a list of vectors of marker positions).
- ind
Individual to plot, either a numeric index or an ID (can be a vector).
- chr
Selected chromosomes to plot; a vector of character strings.
- col
Vector of colors for the different genotypes.
- shift
If TRUE, shift the chromosomes so they all start at 0.
- chrwidth
Total width of rectangles for each chromosome, as a fraction of the distance between them.
- ...
Additional graphics parameters
Value
object of class ggplot.
Examples
# load qtl2 package for data and genoprob calculation
library(qtl2)
# read data
iron <- read_cross2(system.file("extdata", "iron.zip", package="qtl2"))
# insert pseudomarkers into map
map <- insert_pseudomarkers(iron$gmap, step=1)
# calculate genotype probabilities
probs <- calc_genoprob(iron, map, error_prob=0.002)
# inferred genotypes
geno <- maxmarg(probs)
# plot the inferred genotypes for the first individual
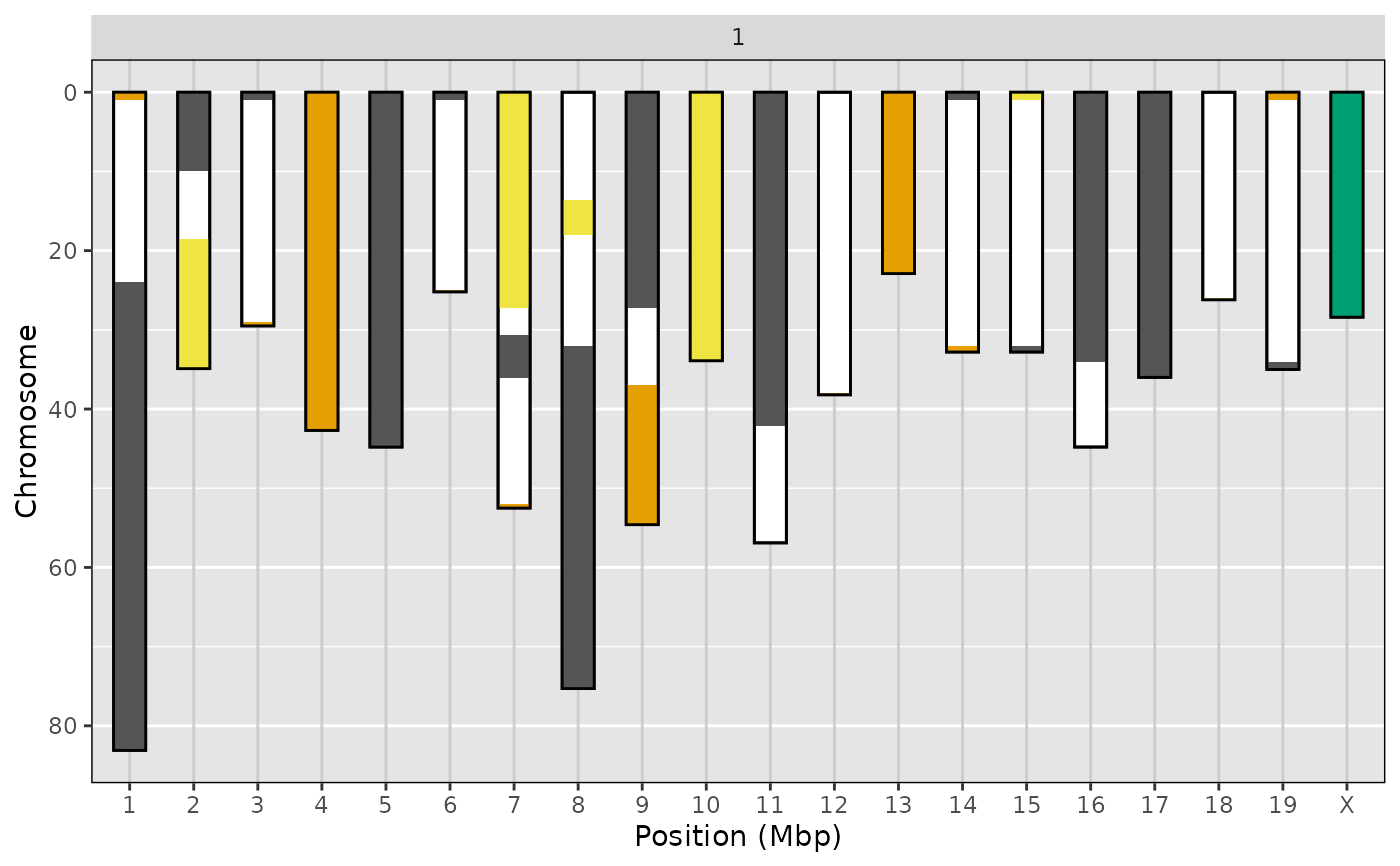
ggplot_onegeno(geno, map, shift = TRUE)
#> Warning: Some ind not in cross: X
#> Warning: The `size` argument of `element_line()` is deprecated as of ggplot2 3.4.0.
#> ℹ Please use the `linewidth` argument instead.
#> ℹ The deprecated feature was likely used in the qtl2ggplot package.
#> Please report the issue at
#> <https://github.com/byandell-sysgen/qtl2ggplot/issues>.
 # plot the inferred genotypes for the first four individuals
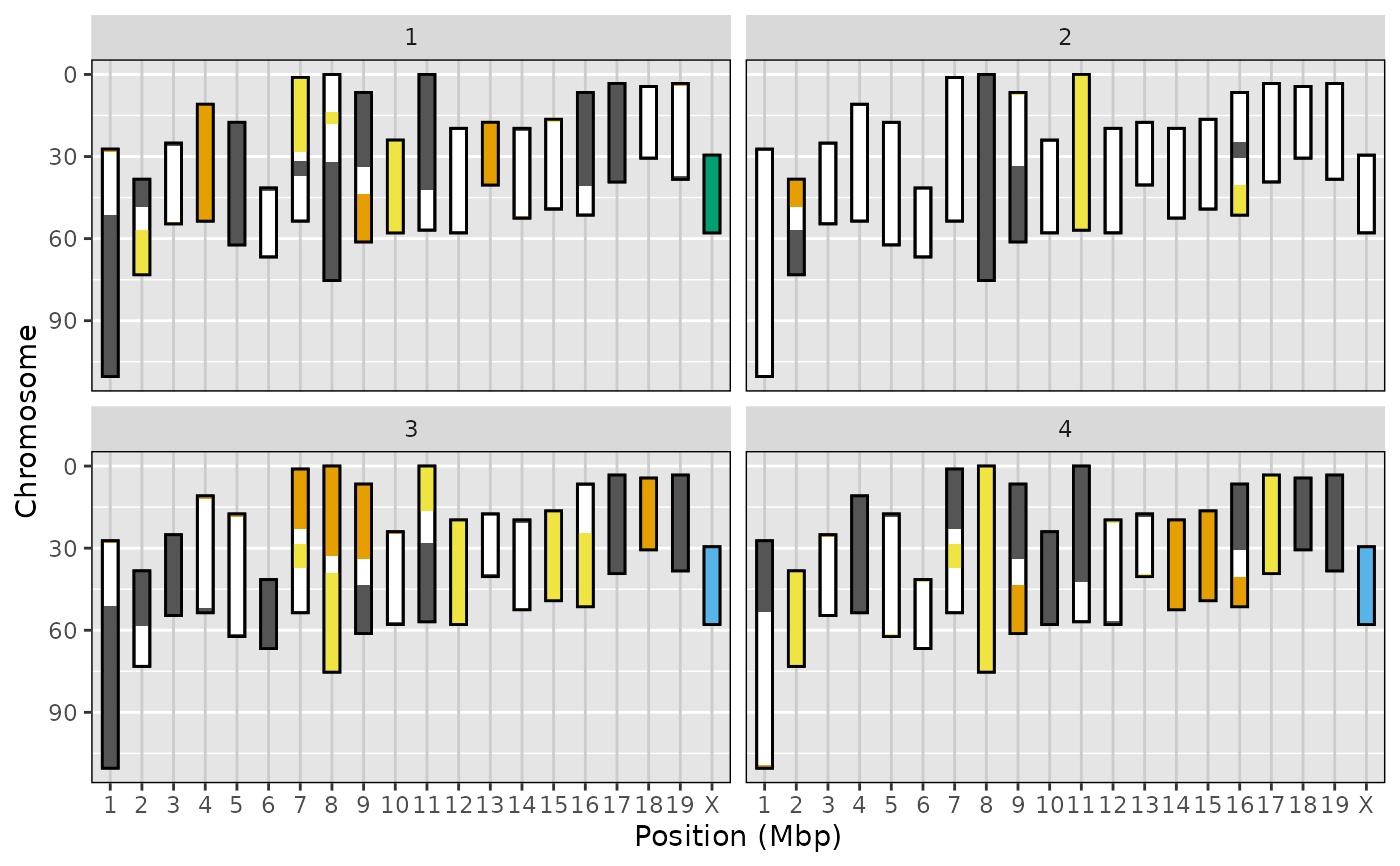
ggplot_onegeno(geno, map, ind=1:4)
#> Warning: Some ind not in cross: X
# plot the inferred genotypes for the first four individuals
ggplot_onegeno(geno, map, ind=1:4)
#> Warning: Some ind not in cross: X